The disk inspector.
Find files that occupy too much space or haven’t been modified in a long time. Remove hidden garbage left by both installed and uninstalled apps, and save time and money by reusing your existing storage.
Disk Graph is available for Mac, iPad and iPhone.
I see.
You can select any volume or directory reachable in the Finder (on macOS) or the Files app (on iOS/iPadOS).
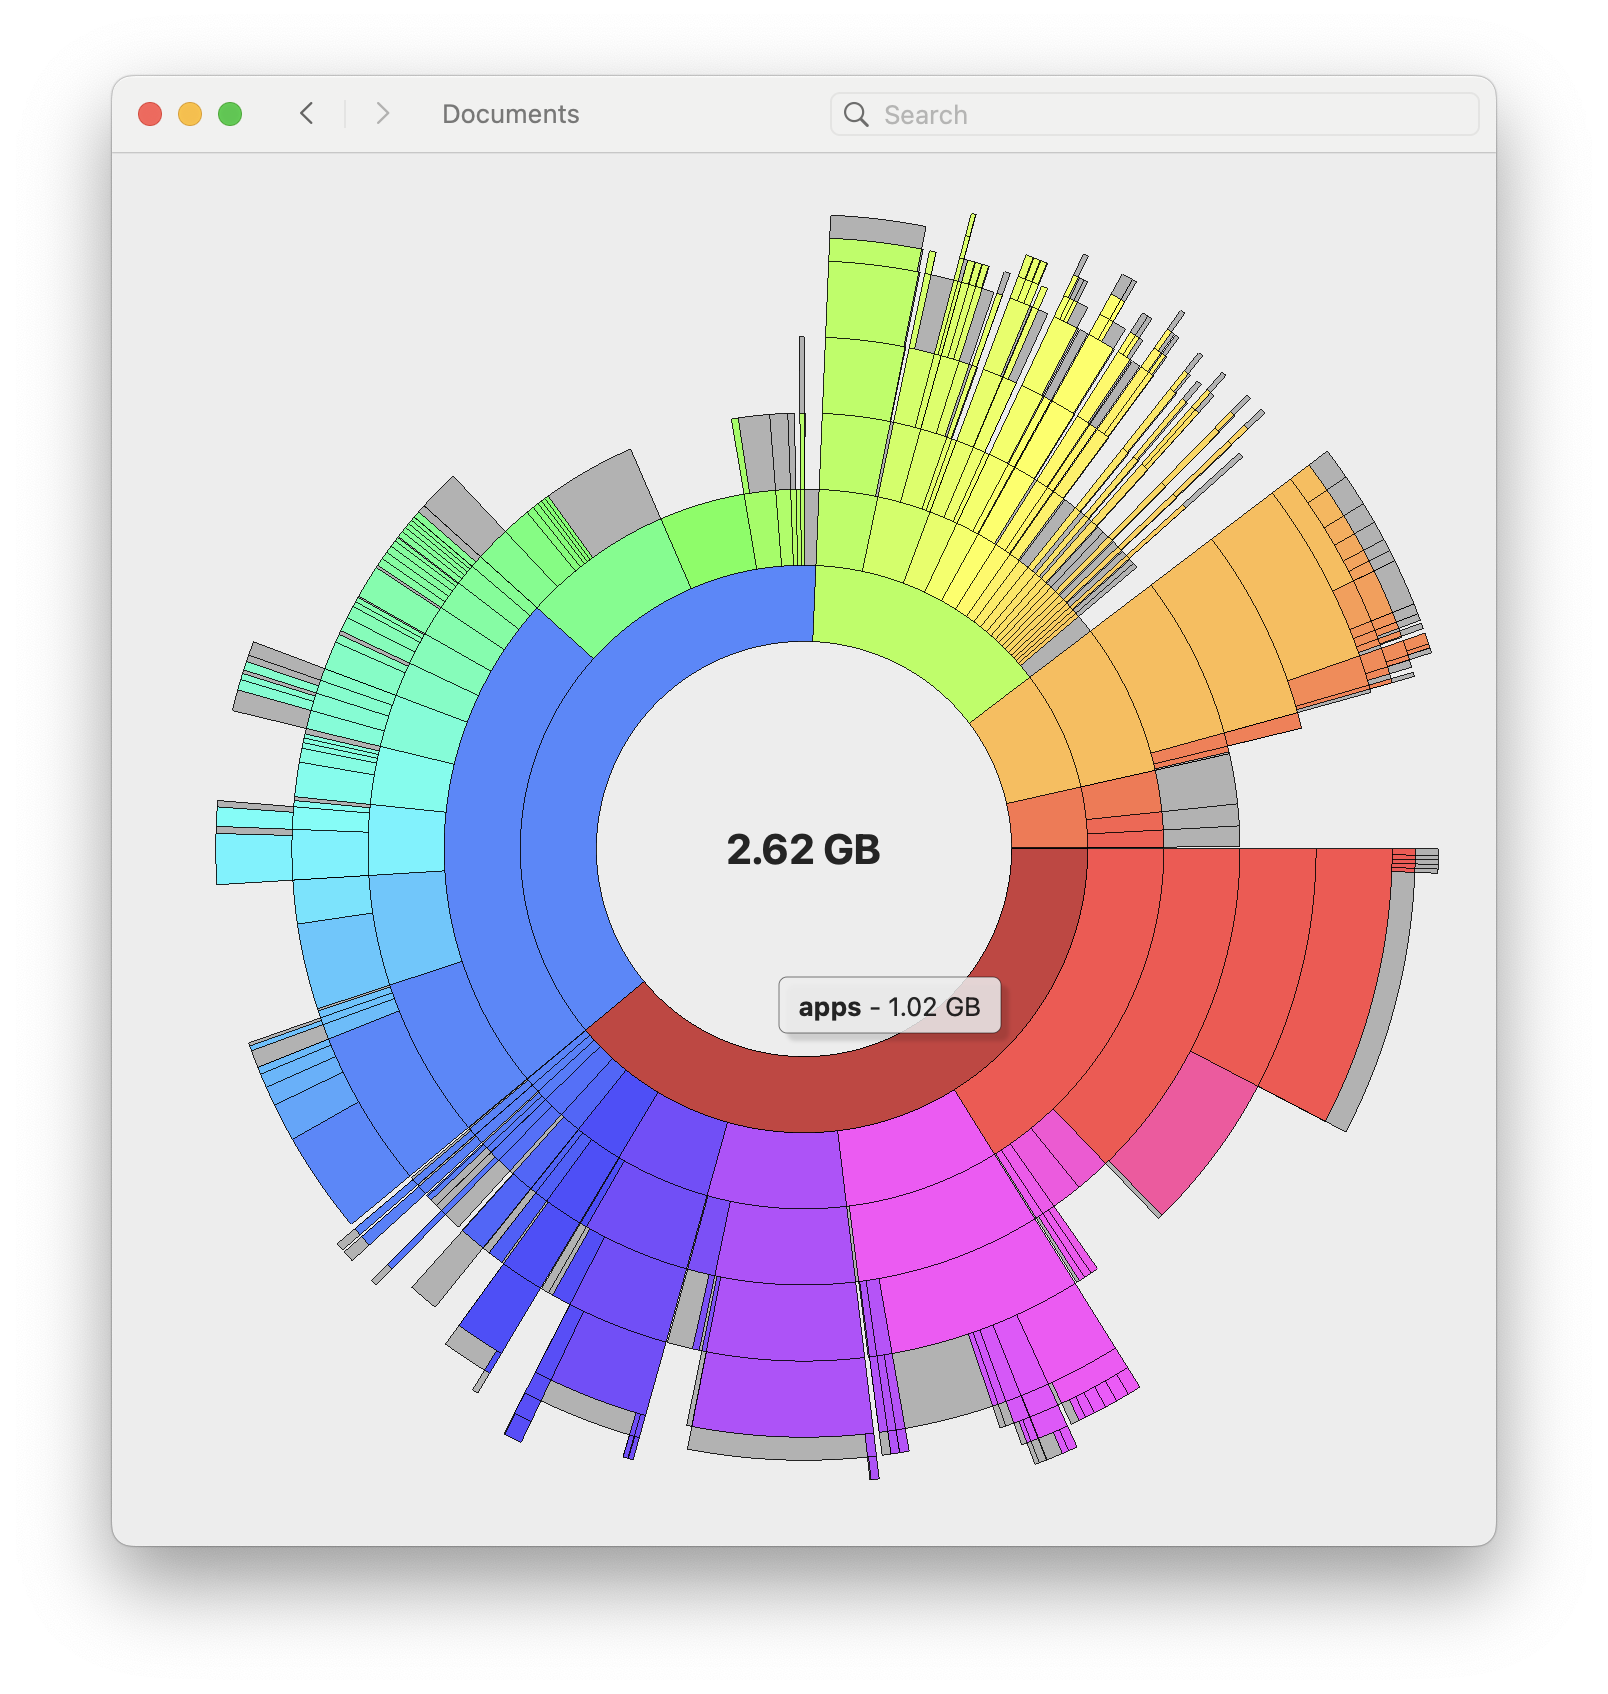
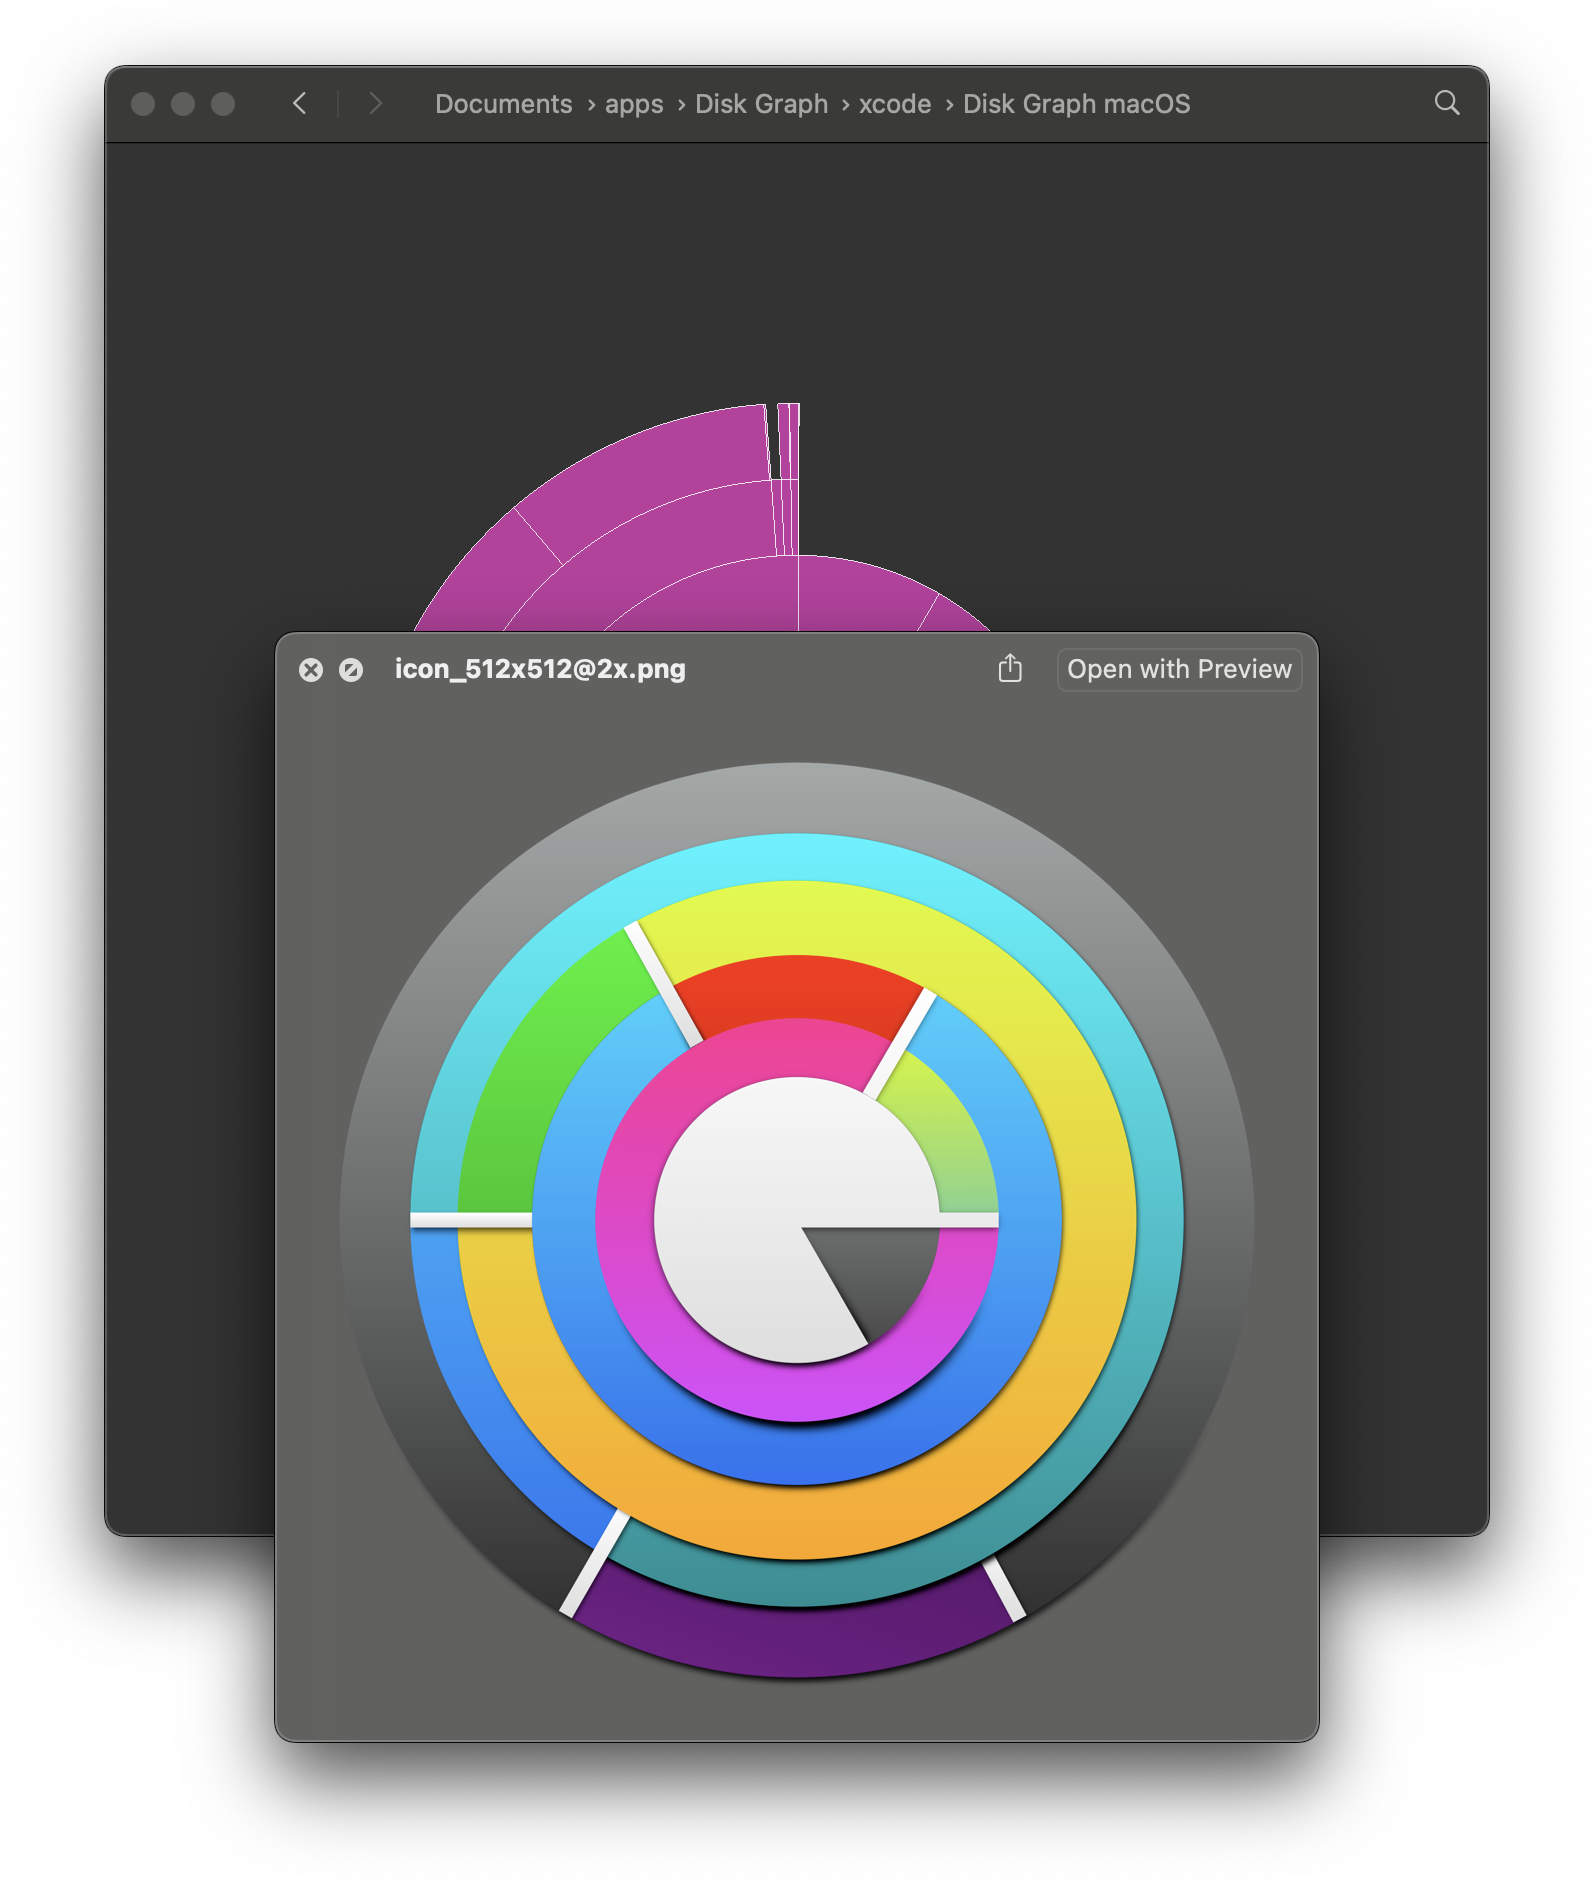
By default, the files are shown as a pie chart: each circle represents one level of the directory hierarchy and the size of each section is proportional to the corresponding file size. When moving the mouse over a section, the name and size of the file are displayed.

Responsive navigation.
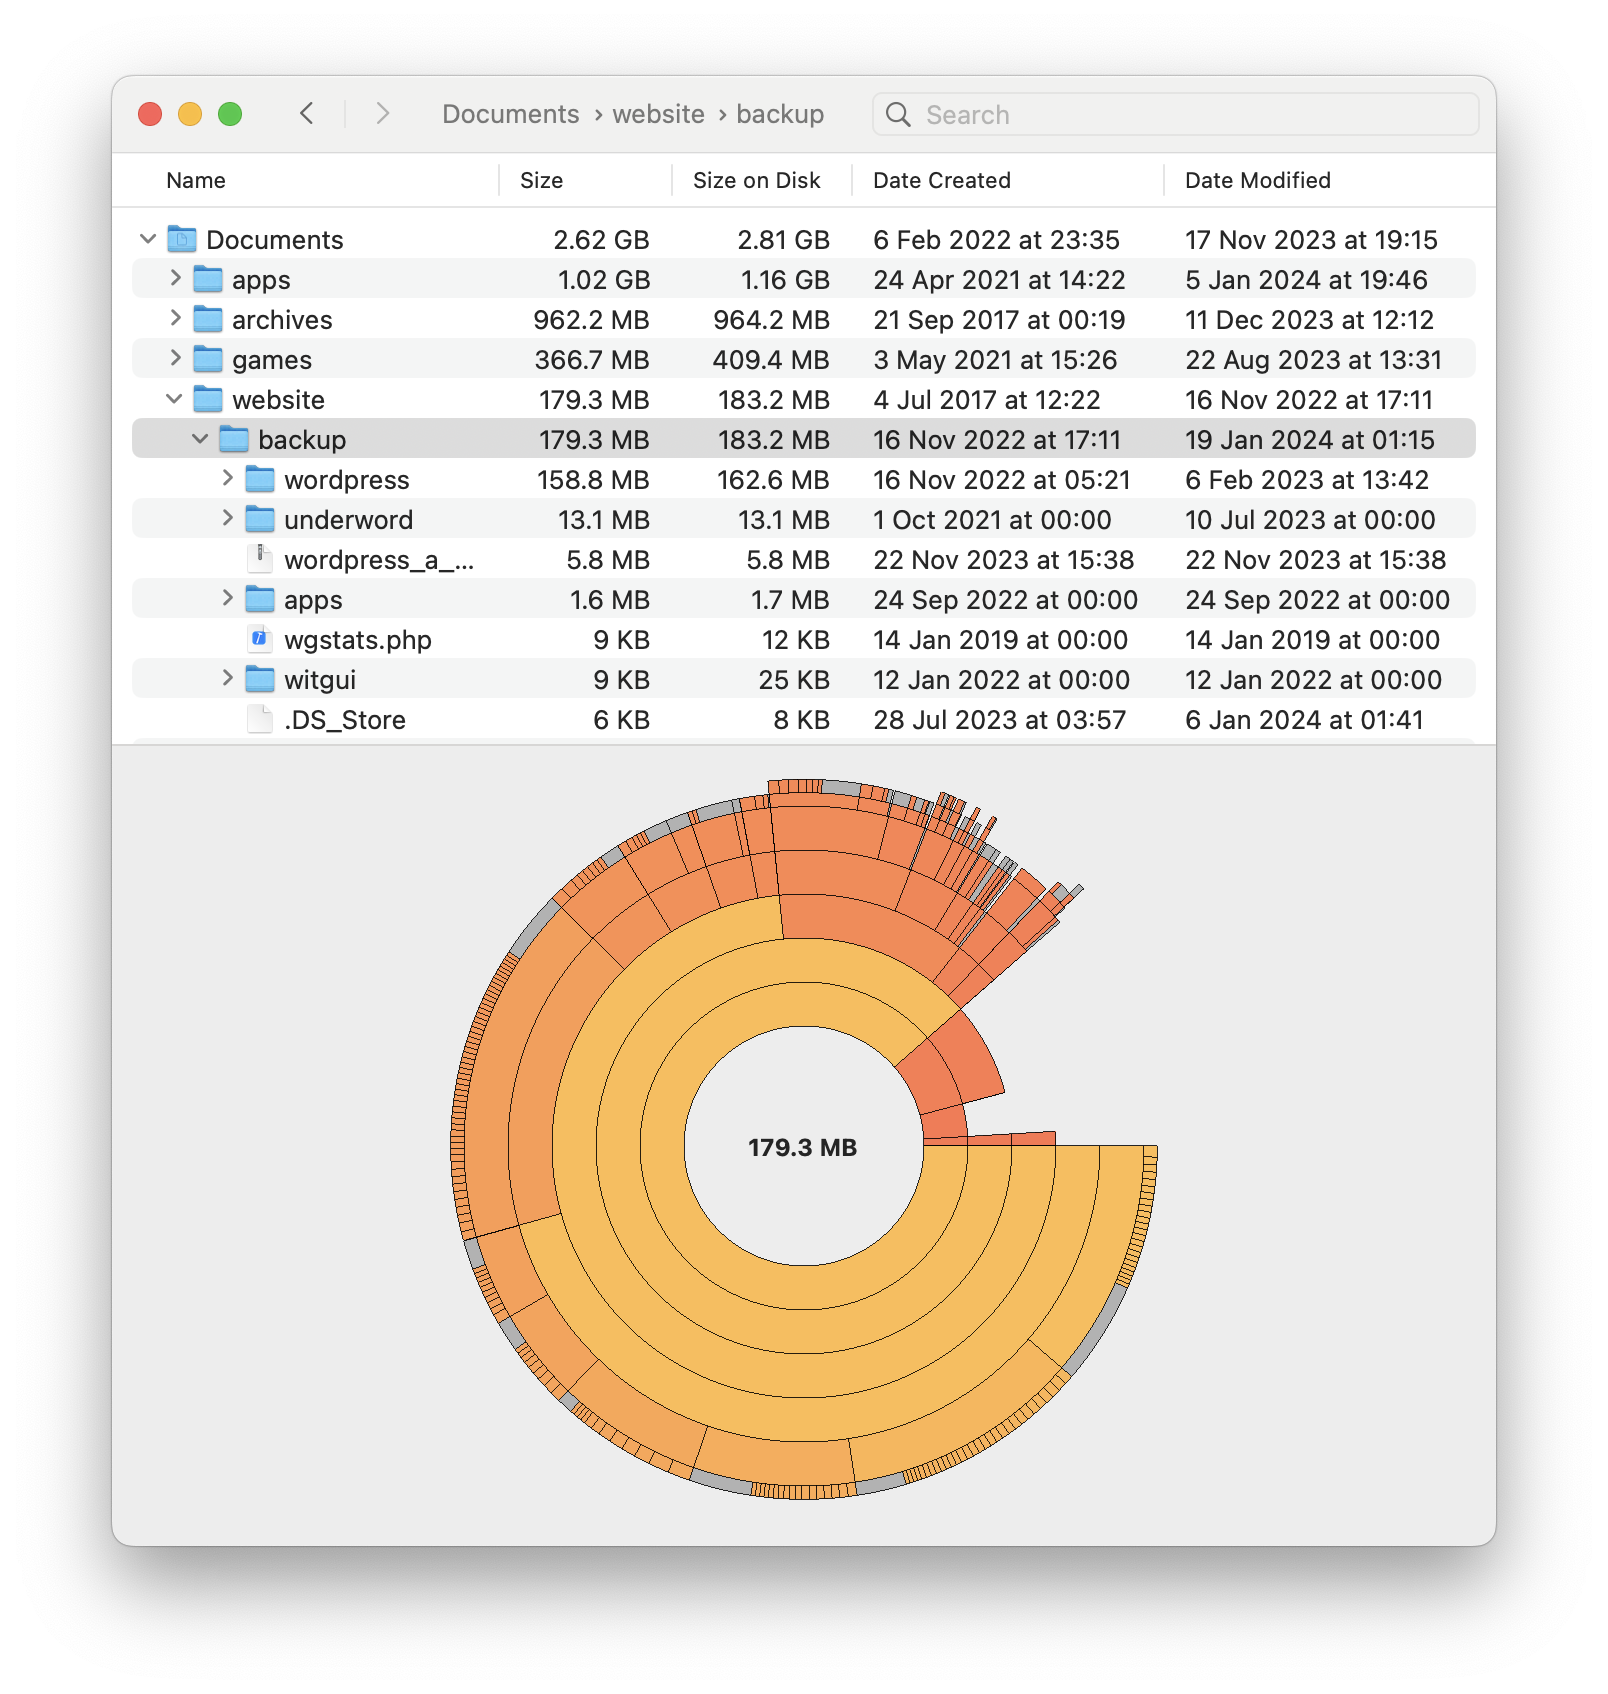
You can freely navigate inside the graph: click on a directory to expand it and get a better view of its contents.
If you want to see all file names and attributes, or some files are too small to see in the graph, just show the file list.
Everything at a glance.
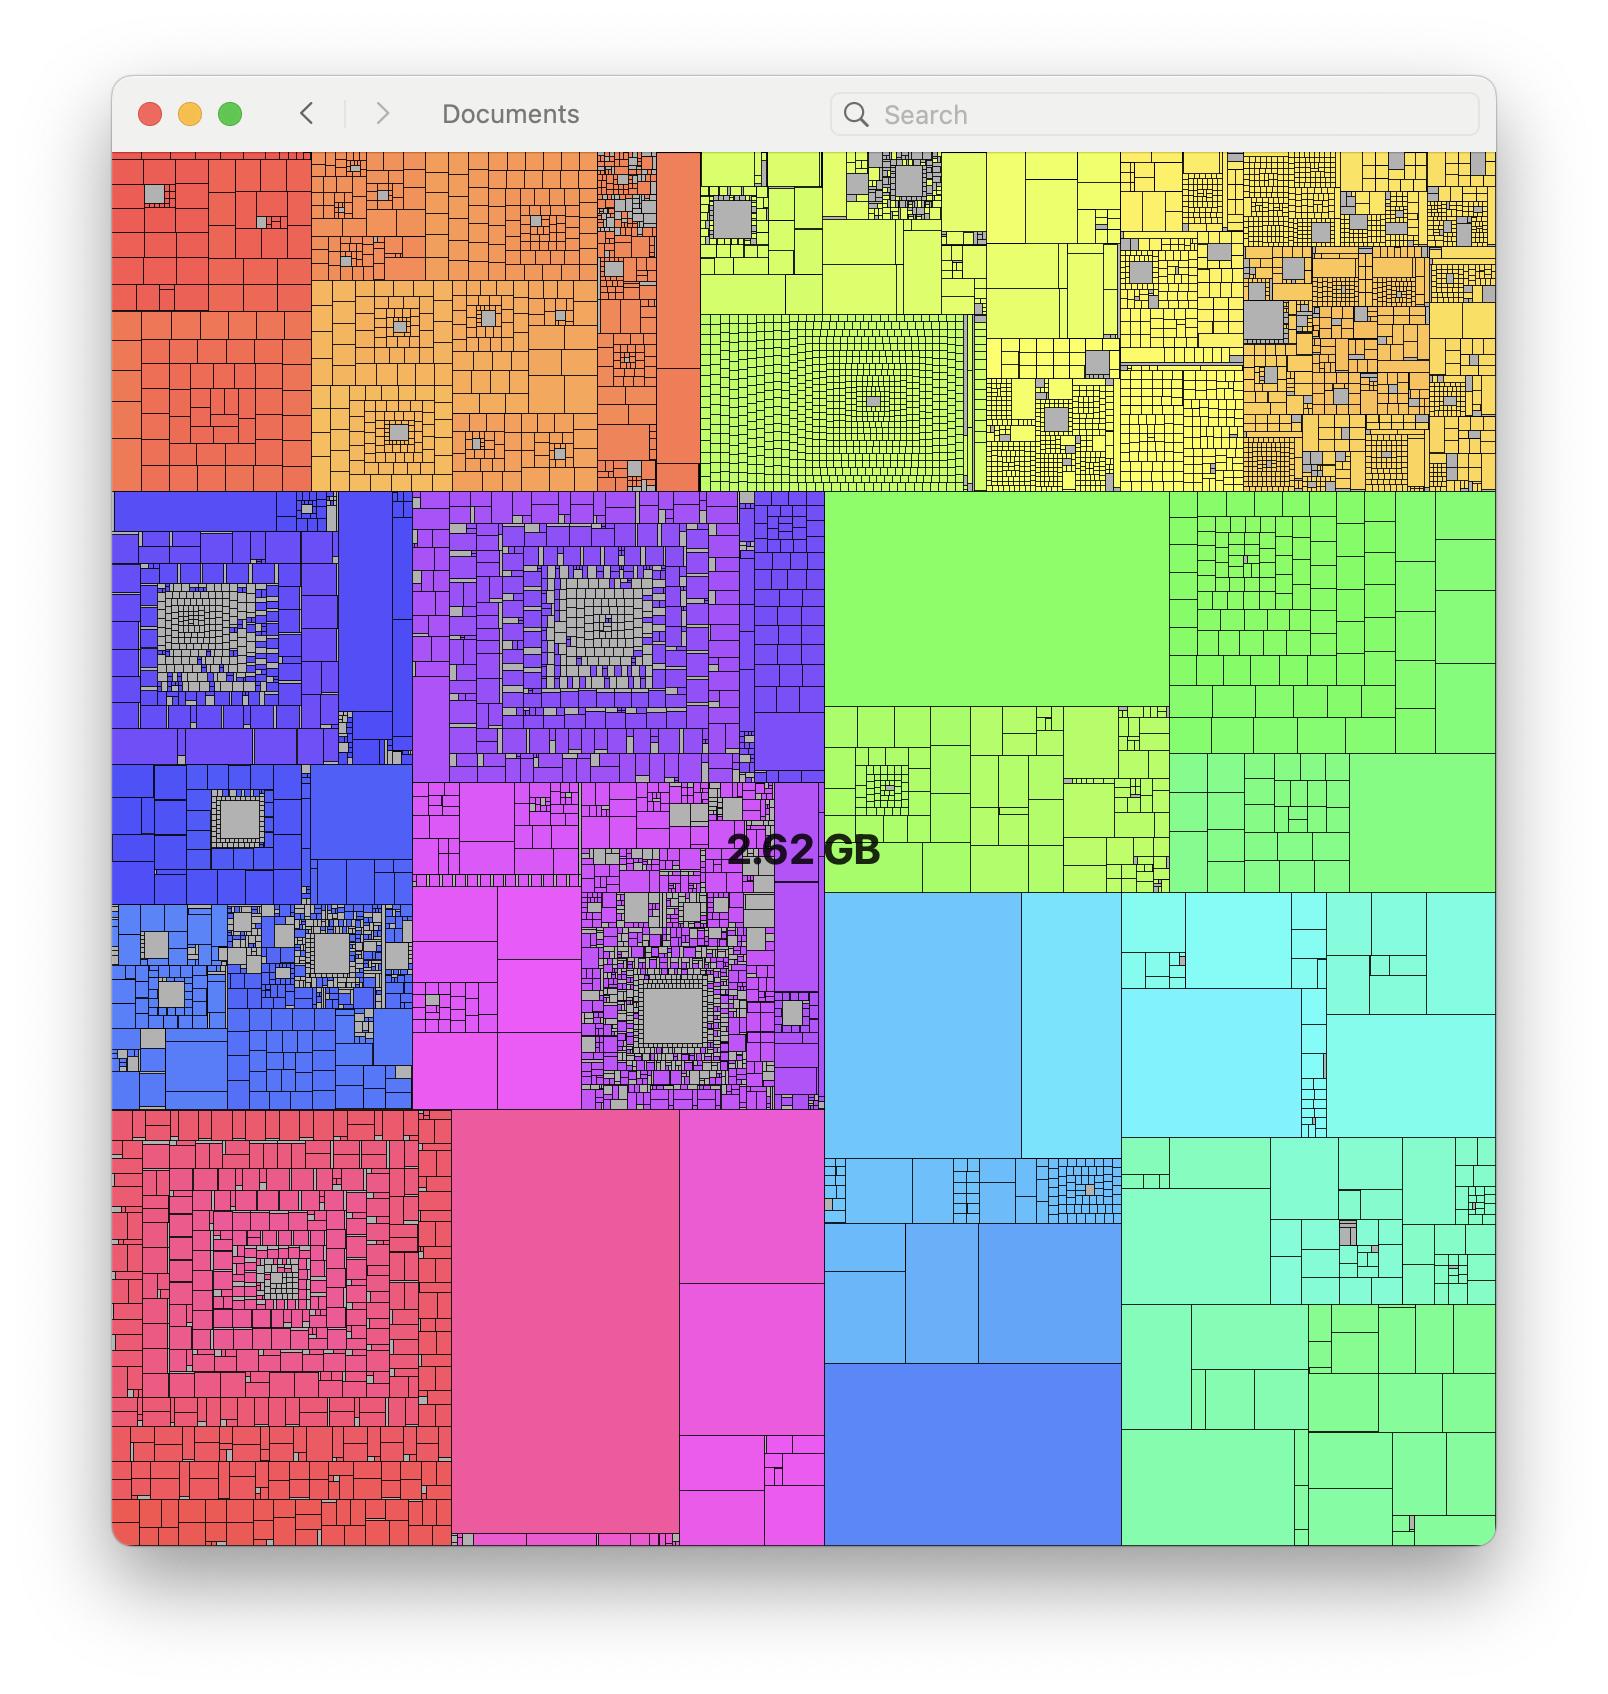
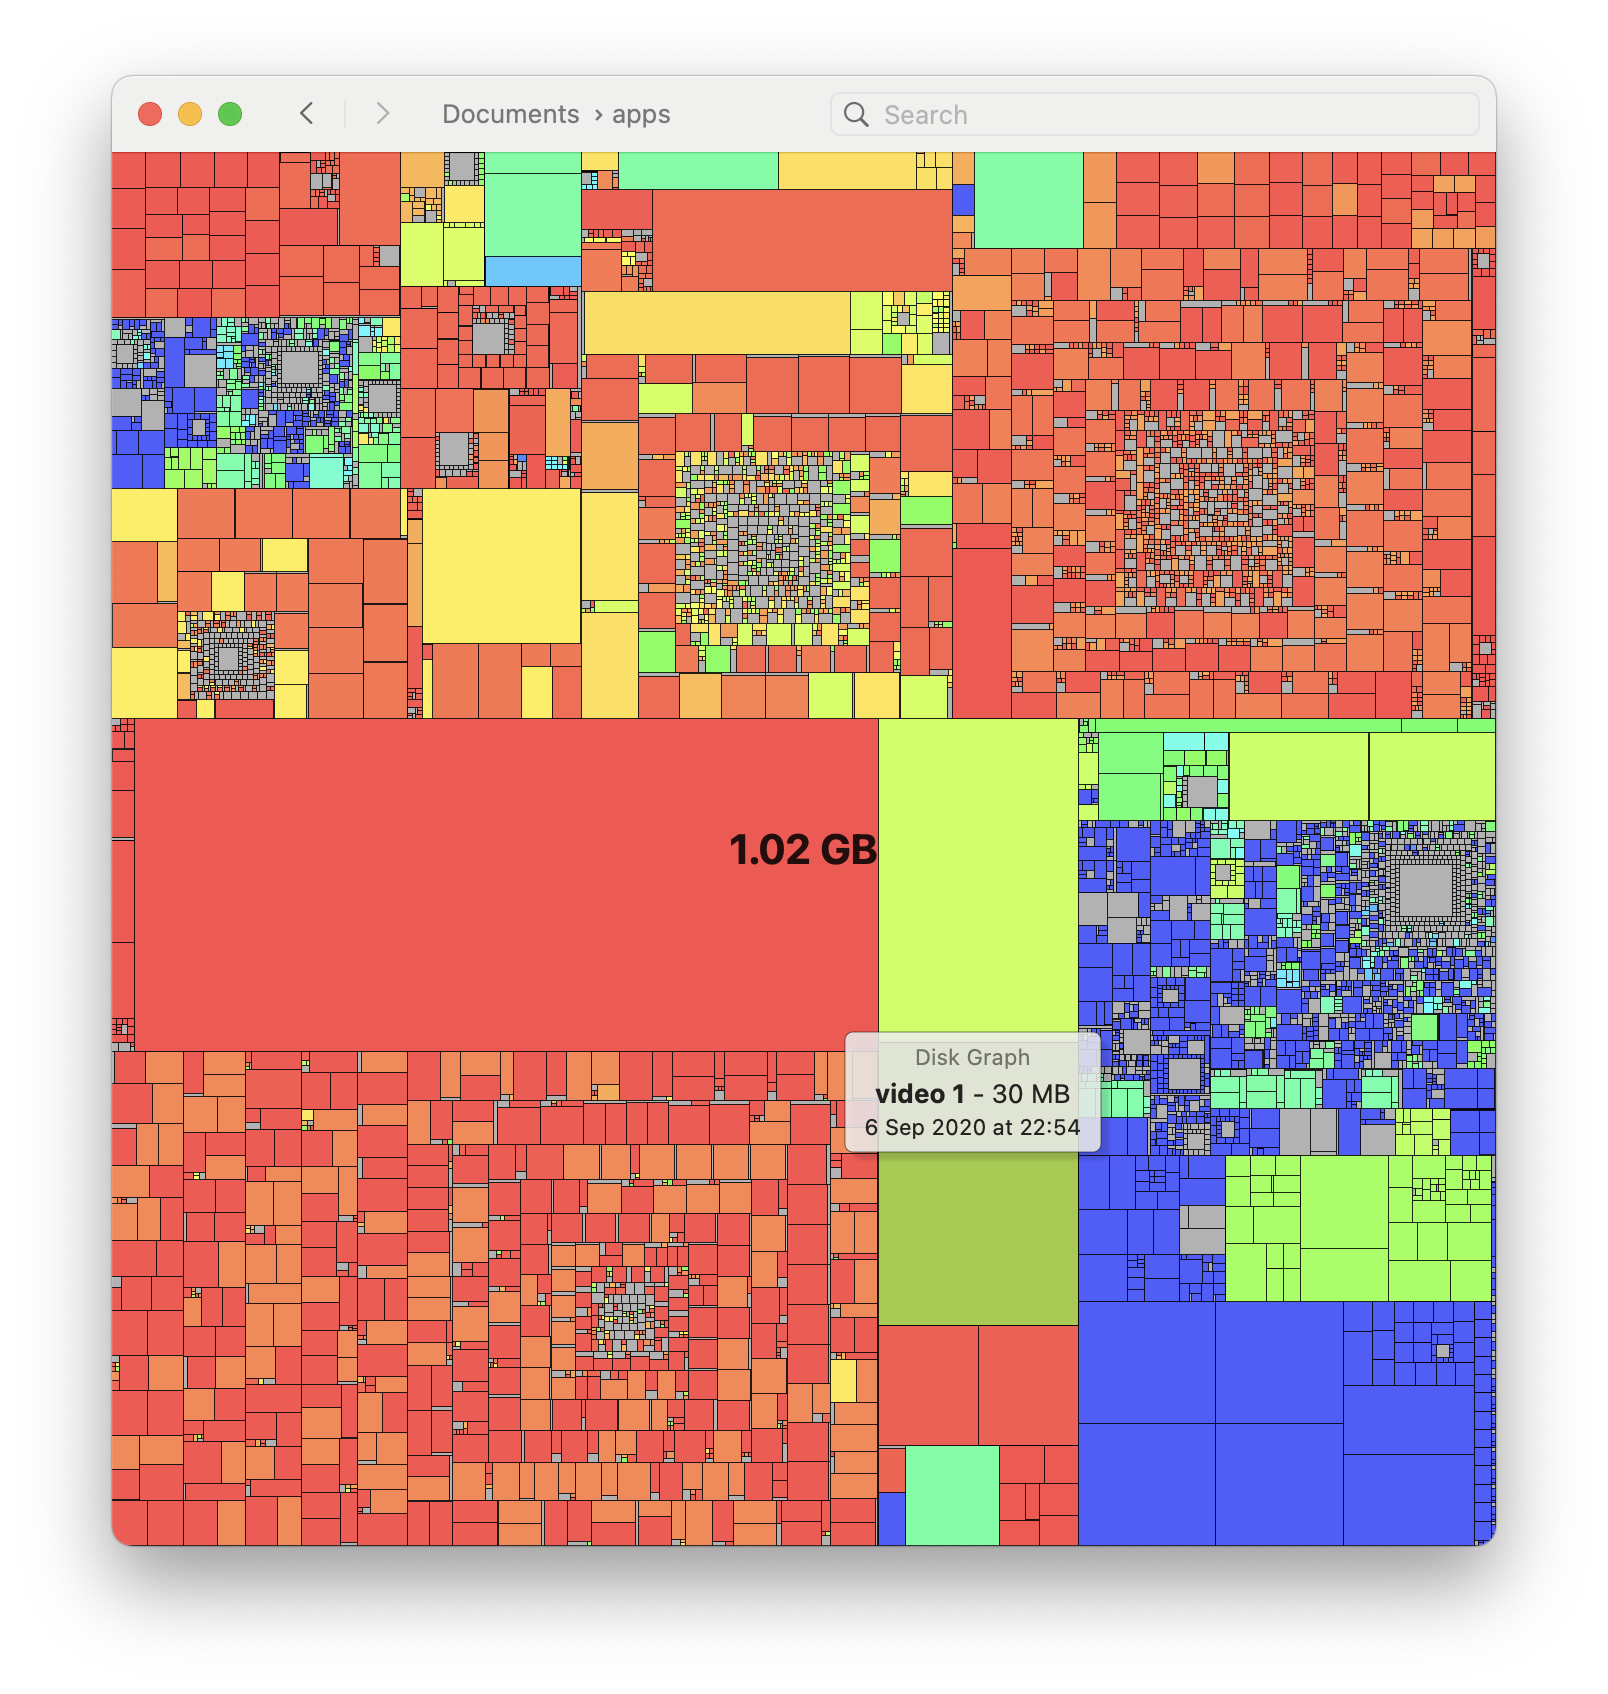
You can switch anytime to the tree map, which displays all files regardless how deep they are inside the directory.

Hot, hotter.
By default, files are colored according to their position on the hue wheel. You can also color them according to their creation or modification date: a warmer color indicates a recent file, while a cooler color an older one.
Take action.
From the File or context menu you can show a file’s preview, show it in the Finder or move it directly to the bin, or just use the keyboard shortcut for even faster cleanup operations.
Temporal snapshots.
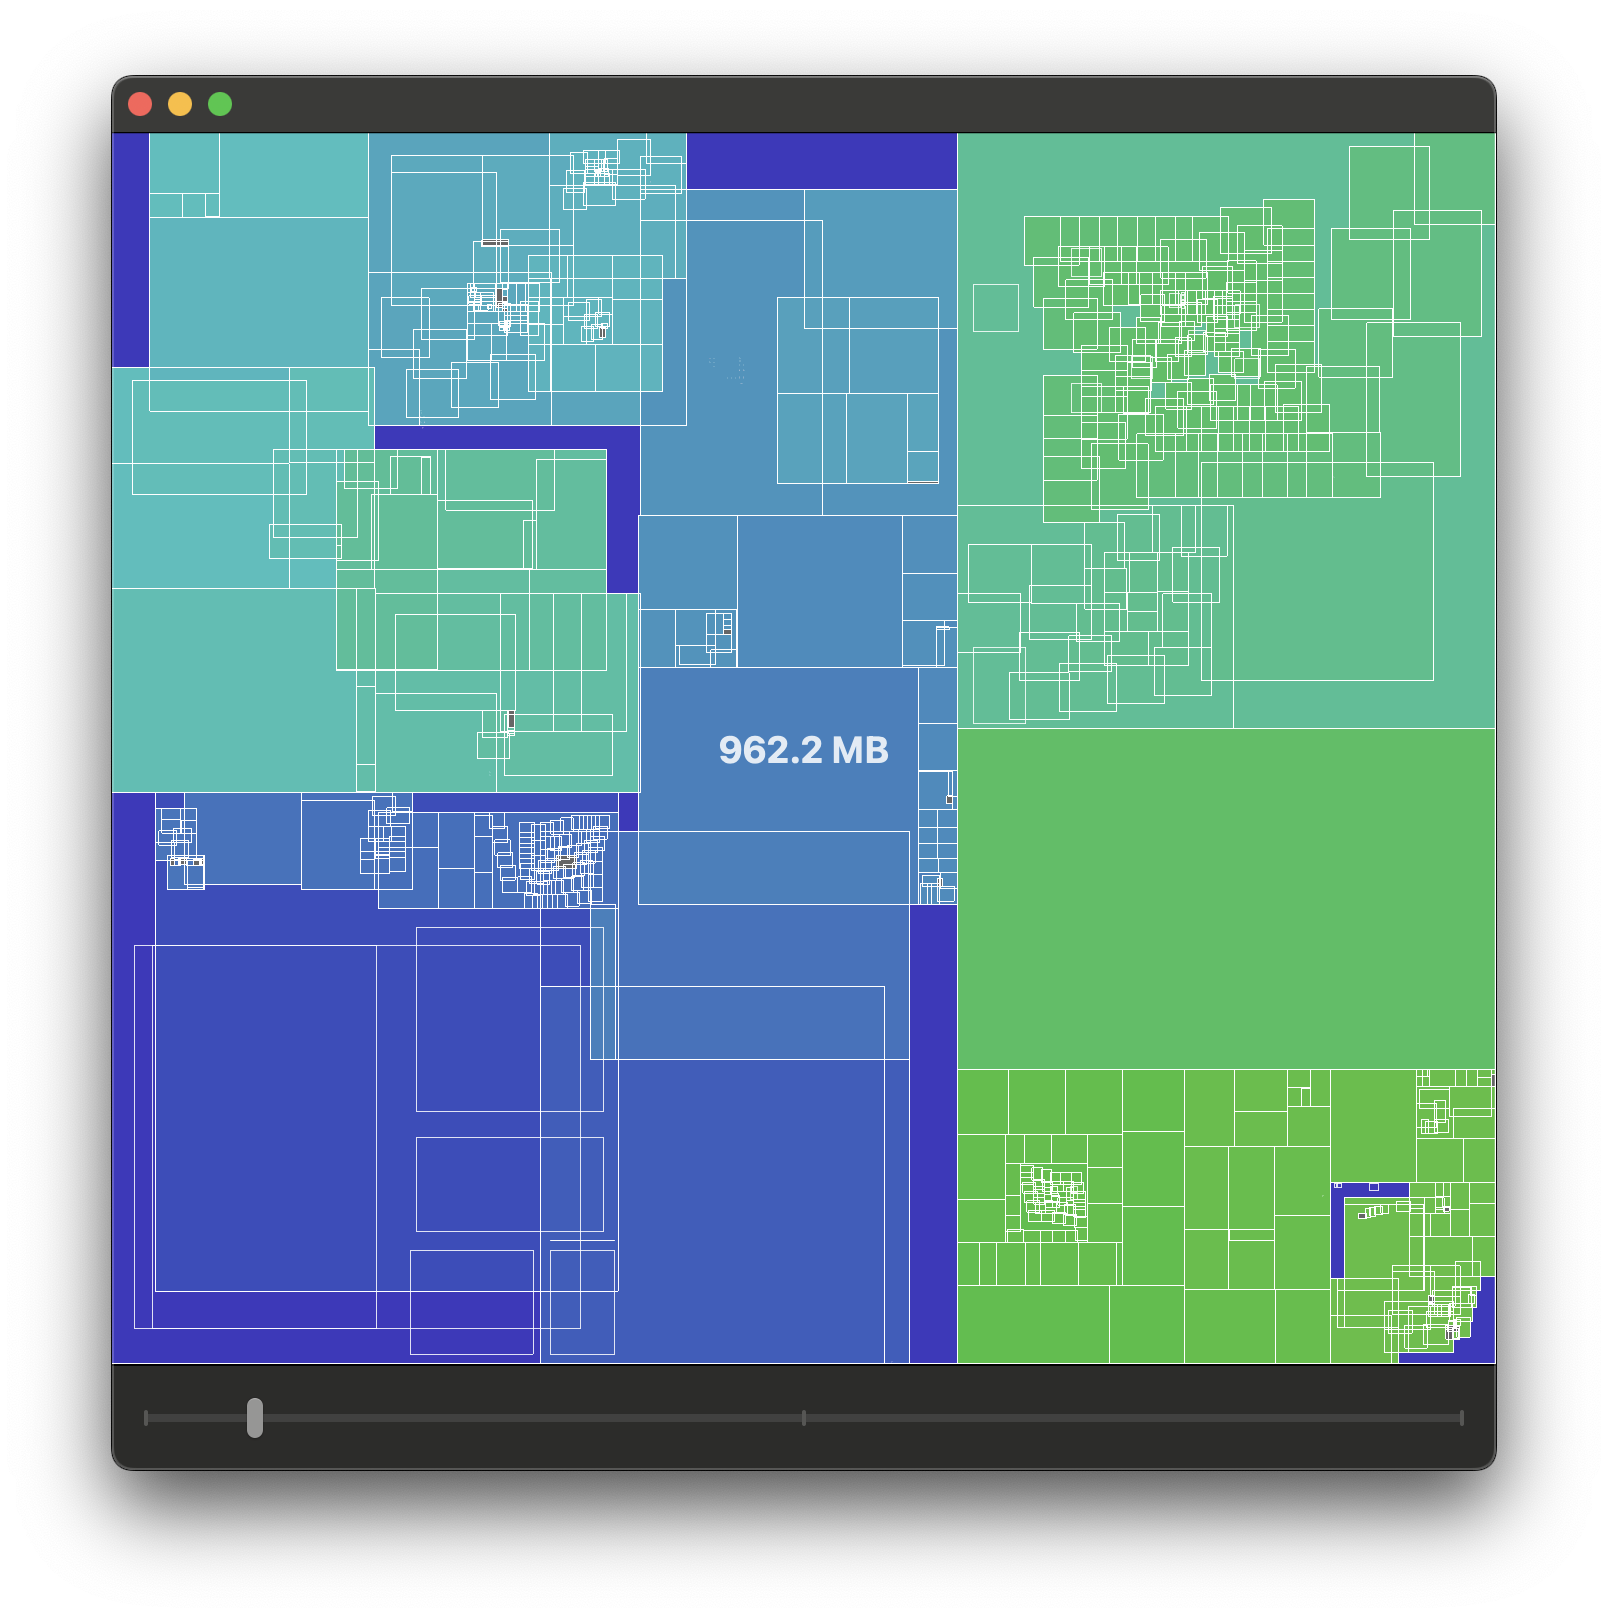
Disk Graph can export a scanned volume or directory as a snapshot file. A snapshot can be opened later as if it was a regular directory, so you can see what it contained at that point in time. Multiple snapshots and directories can be opened as a file sequence: an interactive animation that shows the transition between the selected snapshots and directories.
Quick access.
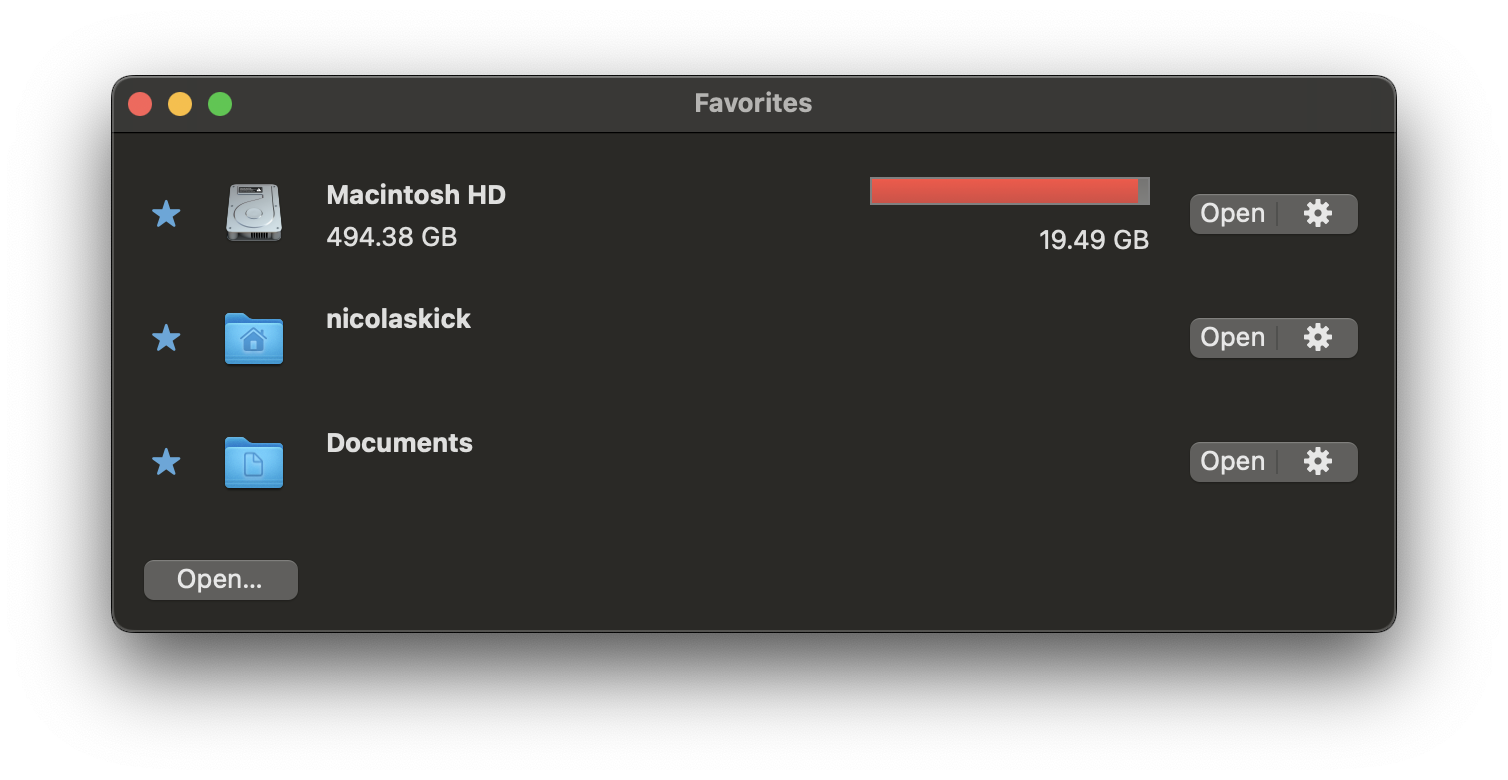
In the main window you can save your favorite volumes and directories and inspect them with one click.

About
I created Disk Graph because I wanted to regain control over my disk space.
Disk Graph doesn’t use any proprietary file format. All produced files can be viewed in a text editor: favorites and snapshots are saved in JSON or TSV files.
Connect
Do you need help, want to report an issue, suggest a new feature or start a discussion?
